
Using Gemini to Help Analyze the Collection for my Local Library
What's in your library anyway?

How do you make a blog post about data analysis more interesting? I’ve been sitting on an analysis I did for my local library for a couple of weeks thinking about how to write this entry (“Top 10 things your library is missing!”; “I analyzed a local library collection and you won’t believe what I found!”).
Let’s be honest though: analysis can be pretty dry unless you’re actually invested in the questions being answered. I started writing this and got bored reading my own writing. I even tried to have AI jazz it up, but it was still boring… and also lacked a soul. Skip ahead to today and I’ve decided that I’m early enough in my subscriber count (9 as of today :D — although I think one of those is me…) that you’re probably reading this because you know who I am rather than because you’re part of an audience enchanted by my witty writing. So let’s cut to it! My wife is a librarian and for a few years now her library has wanted to really dissect their collection to understand circulation (that is, what gets borrowed). However, the collection is not currently labeled in a way that is meaningful to them. So they need better labels for cheap. That’s something I can do.
The library has several sections (physical locations because this library exists in the real world) and they can run analyses on those locations. However, one of the largest sections, Fiction, is just that: Fiction. The library would like to know in more granular detail what genres of fiction tend to circulate more and whether they need to adjust what’s in the collection accordingly. No problem! As long as it doesn’t need to be 100% accurate, we can punt that to AI and get some reasonable genre labels. The rest of the analysis is well within my wheelhouse.
Exploratory Analysis
Process
My process for doing an Exploratory Data Analysis (EDA) is pretty straightforward at this point. Generally, I start by looking at numeric columns and analyze distributions, missing values, errors, etc. Then I look at any categorical data and analyze frequency and proportions, again flagging any missing values or things that generally seem out of place. The general idea is to get a good feel for what is in the data and what are promising avenues to explore. Since I’ve never looked at library collection data, I also needed a Subject Matter Expert (SME) to help me with column labels I didn’t understand (surprise, this was my wife).
When starting an EDA I try to have an idea in mind of the types of questions I would answer in a given dataset or the types of questions a stakeholder is interested in. This way I’m interrogating the quality and relationships of the data with a bit of purpose. The process is hand-wavy, though, because after >10 years of collecting and exploring various datasets I tend to follow my intuition rather than a checklist.
The purpose of this EDA was to understand the relationship between the makeup of the collection, the locations in the library, and how they circulate. Generally speaking, the library wants to have a collection that is proportionate to the kinds of things that circulate. If the collection has 50% sci-fi books, then you would hope that 50% of your circulations are also sci-fi. The relationship between circulations and collection isn’t totally independent. For example, people would get bored of a stale collection and a simple analysis might lead you to believe people don’t want that genre. Of course, libraries generally try to keep a diverse and new collection so that’s not much of a concern (I’m not a librarian though, so librarians feel free to chime in).
Here’s what I found surprising after diving into the nitty-gritty of the library:
Large print books circulate well and are very popular. The section itself isn’t a large portion of the library, but apparently I’m the odd one who likes those old Sherlock Holmes leather bound tomes with size 8 font, two columns, and a ribbon to mark your page.
New books circulate much more often and most of the new items added during the year circulate at least once.
Kids read more books of all kinds than adults (by number of items checked out. I don’t know about number of pages).
My wife informed me 1, 2, and 3 are completely unsurprising.
Most of the analysis showed that the library is meeting people’s needs and there aren’t any glaring misalignments with the collection vs. circulation. Some improvements could be made, though. (Non-fiction doesn’t circulate that well relative to its size… and my wife tells me it’s on a separate floor with lights that turn off automatically after three minutes. I’m not even sure where that floor is, so that might say something.)
The Data
The collection itself is made up of ~50,000 items. This includes books, CDs, DVDs, some Nintendo Switch games, historical records, etc. etc. Anything in the library is included in the collections data. Some things (like in the “Special Collection”) can’t be circulated so you need to use them at the library itself. Other items come from Interlibrary Loan (a sharing agreement between public libraries) and so are only temporarily in the library. I don’t think it will be productive to go deep into the details of the columns, missing data, and random distributions, so I’ll leave that to those who want to look through the GitHub repo. Instead, I’ll just highlight some things in the data that I found meaningful.
Note: you will see the acronym CWMARS pop up in the dataset a lot. CWMARS stands for Central and Western Massachusetts Automated Resource Sharing, and they are a library consortium in which my wife’s library participates. CWMARS manages almost all of the data storage and organization for their member libraries.
Bibliographic details (Title, Author, Publisher, Call Number, etc.)
Collection metadata (Owning Library, Shelving Location, CWMARS Format, ARIS Format, etc.)
Circulation statistics (Total Circs, Current Year (CY) Circs, Previous Year (PY) Circs)
Key dates (Create Date/Time, Active Date/Time)
ILL does not in fact mean a sick record that should be removed or modified. It stands for Interlibrary Loan. An ILL item should not be shelved because it has to go back home to the original library.
“DO NOT USE” is in fact in use and is a valid entry in the data. It is another kind of temporary item in the collection. Both ILL and “DO NOT USE” are not important for understanding our library collection, however, as they are items that have come from a different owning institution and we’re simply acting as a middle-man to distribute.
To be able to accurately analyze circulation statistics, the only fields available were CY Circs and PY Circs for Current Year and Previous Year circulations. Unfortunately, without more event data this will have to do. I created a flag (added_2024) to distinguish items added to the collection during 2024 from those existing prior. Then I filtered out any items added in 2025 since those couldn’t have circulated in 2024 for obvious reasons. I also filtered out items that can’t circulate. These included: “Library Use Only,” “Noncirculating,” “DO NOT USE,” “Adult Reference,” and “Special Collection”.
Circulation Analysis
The core of my analysis examines circulation data, primarily focusing on the “PY Circs” (circulations in 2024) to assess recent performance. Metrics I used include:
Circulation Average: Average circulations per item. (PY Circs / Number of Items)
Proportion of Collection Circulating: Percentage of items in a category that circulated at least once in 2024.
Collection Makeup vs. Circulation Share: Comparing a category’s share of the total collection to its share of total circulations. (Number of items in Category/Total number of items vs. Category Circs/Total Circs)
By Shelving Location
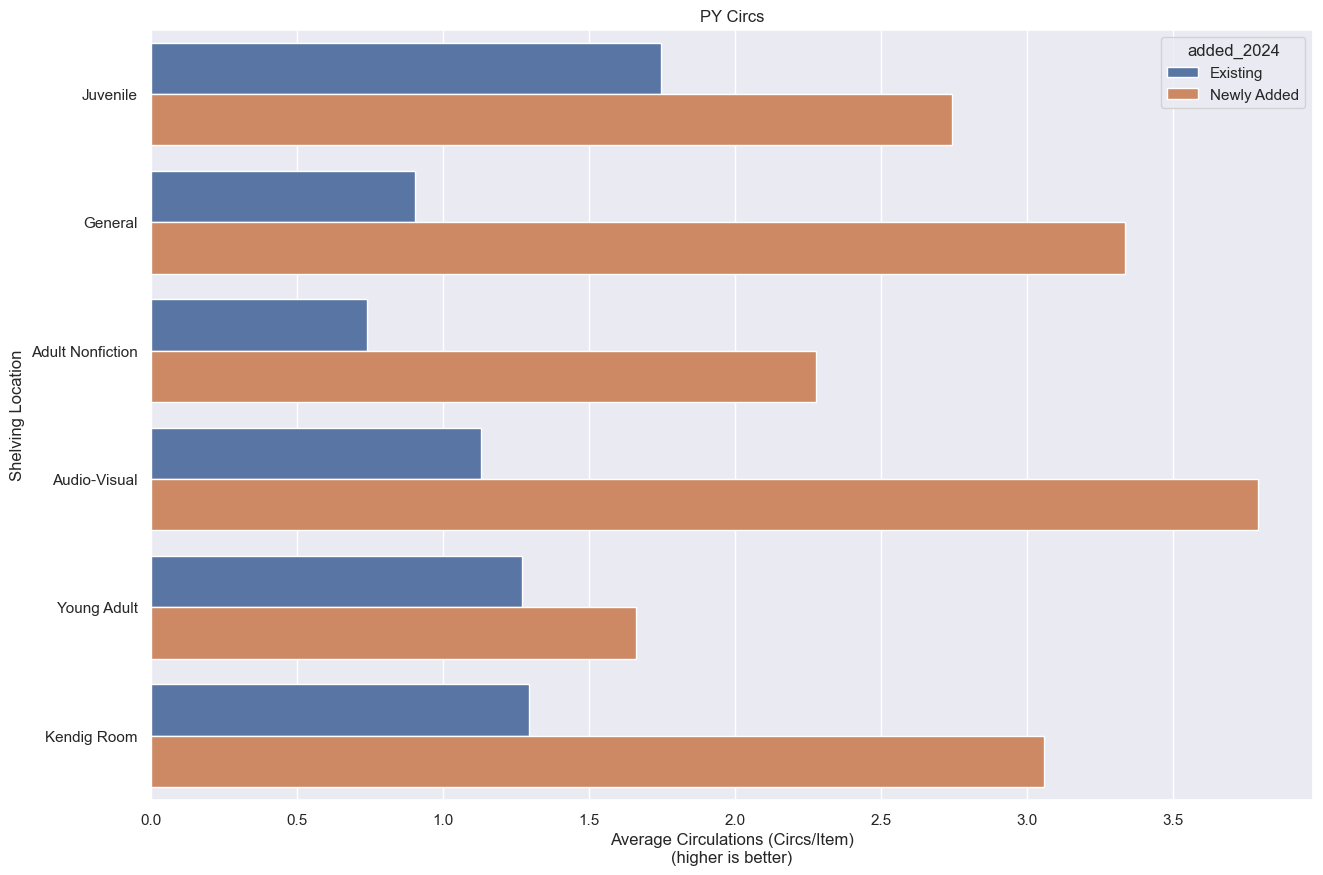
The physical areas of the library generally hold different types of books. Children’s books in the children’s section, fiction in the fiction section, etc. We can get a general overview of the circulation statistics just by comparing locations. For average circulations per item (Fig. 1) I found:
Items added in 2024 (“Newly Added”) consistently outperformed “Existing” items across all shelving locations.
Juvenile and Kendig Room (the Large Print room) demonstrated the highest circulation average for existing items.
Audio-Visual (e.g. CDs, DVDs, Blu-Ray), Kendig Room, and General (Fiction) saw the most significant circulation average for newly added items.
Adult Nonfiction had the lowest circulation average for existing items and second lowest for newly added items (Young Adult was lowest).
Young Adult showed a smaller difference in circulation average between existing and newly added items compared to other categories, and lowest average circulations per item for newly added items. I’m speculating here, but possibly teens come to the library less often, leading to existing and new items basically being treated the same, whereas the other sections have more frequent or consistent traffic so new things circulate more often. I don’t have any evidence to back that up though.
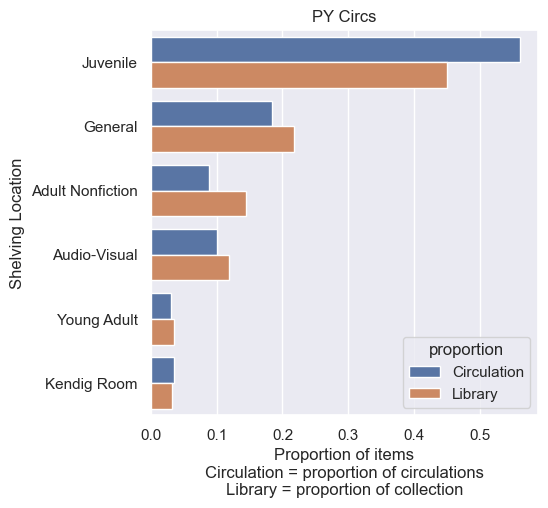
Comparing the makeup of the library collection to the circulation share (proportion of circulations) I found (Fig 2):
Juvenile: Comprises the largest segment of the circulating collection (approx. 45%) and accounts for the largest share of circulations (approx. 56%).
General: The second largest collection segment (approx. 22%), contributing about 18% of circulations.
Adult Nonfiction: Represents about 15% of the collection but only 9% of circulations, indicating lower usage relative to its size.
Audio-Visual: Makes up about 12% of the collection and 10% of circulations.
Kendig Room & Young Adult: Smaller collection segments with circulation shares roughly proportional to their size.
Breaking down “General”
From the initial analysis, we can see that the General section is the second largest and has a significant share of the circulation. However, we’d like to know more. What kinds of books are driving the traffic in this section? Should we buy more horror or more historical fiction? And so on.
To get at these questions, we wanted to further classify the books into sub-genres and do a similar performance analysis as above. I turned to Gemini to generate some labels. To get each genre, the title and author were reviewed by Google’s Gemini “thinking model” (Gemini-2.5-pro). The instructions were to assign one of the specified Genres and only if those genres did not apply, to then assign Literary Fiction, Unknown, or Other.
This was the instruction prompt I used (I left out the examples I provided for brevity. Full prompt available on GitHub):
# --- Genre Definitions ---
ALLOWED_GENRES = [
    "Romance", "Sci Fi", "Fantasy", "Historical Fiction", "Horror",
    "Biographies/Memoirs", "Mystery", "Western", "Christian Fiction", "Thriller"
]
FALLBACK_FICTION = "Literary Fiction"
FALLBACK_NON_FICTION = "Other"
FALLBACK_UNKNOWN = "Unknown"

prompt = """You are an expert book genre classifier.
Your task is to classify each book in the provided list into ONE of the following genres:
%(allowed_genres)s.

Follow these rules strictly:
1. If none of the listed genre names are applicable but the book is clearly a work of fiction, assign "%(fallback_fiction)s".

2. If the book is not a work of fiction (e.g., textbook, self-help, technical manual, cookbook), assign "%(fallback_non_fiction)s".

3. If you do not have enough information from the title and author to confidently classify, or if the item doesn't seem like a book, assign "%(fallback_unknown)s".

4. You MUST ONLY use the provided genre names or the specified fallback options. Do not invent new genres.

5. Respond with a JSON list of objects. Each object must have an "item_id" (matching the input) and a "genre" key.

##Example input format:
(omitted for brevity)

Classify the following books:
%(books_string)s
""" % {"allowed_genres":', '.join(ALLOWED_GENRES),
      "fallback_fiction":FALLBACK_FICTION,
      "fallback_non_fiction":FALLBACK_NON_FICTION,
      "fallback_unknown":FALLBACK_UNKNOWN,
      "books_string":books_json_string}
The list of genres we’re breaking down are as follows:
"Romance", "Sci Fi", "Fantasy", "Historical Fiction", "Horror", "Biographies/Memoirs", "Mystery", "Western", "Christian Fiction", "Thriller"The list was also supposed to include “Chick-lit” but… I forgot it. Or AI forgot it. And since we’ll never know, I’m going to claim it was AI’s fault.
For every fiction item (identified by call numbers starting with “FIC”) I sent batches to Gemini for classification. After about 1.5 hours (and about $4.50 since I sprang for the experimental thinking model) we had about 7500 classified books!
I spot-checked about 25 by comparing to Goodreads, and also compared Mystery and Non-Fiction to labels in the CWMARS format column as a sanity check. Keeping in mind that CWMARS format column is for media type rather than genre, I was pretty pleased with the results. They were good enough that any differences would be a matter of preference rather than objectively incorrect. It is likely some labels are wrong (or at least debatable), but for an aggregate analysis it’s not likely to shift the overall conclusions significantly. If we wanted granular recommendations, I might be more particular.
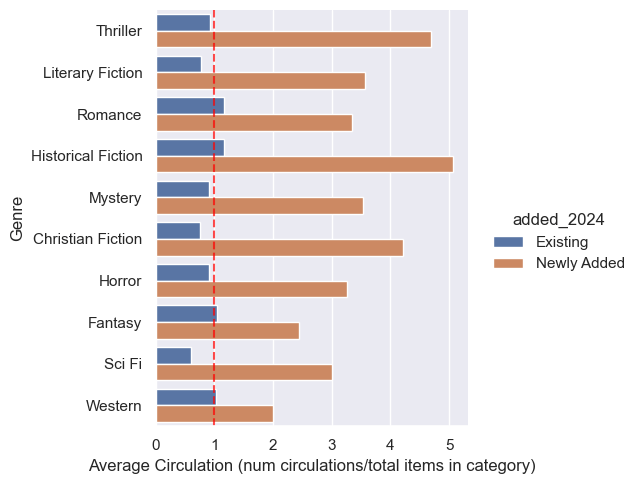
For the circulation average (Circs/Item) by genre I found:
Similar to the overall, newly added items consistently outperformed existing items across all genres (generally >3 circs/item for newly added and <1 for existing; Fig 3).
Thriller, Historical Fiction, and Christian Fiction showed the highest circulation average for newly added books.
For existing books, Romance, Historical Fiction, Fantasy, and Western had an average above 1.0 (circulating more than once per item on average).
Sci-Fi only had 5 books, but it turns out there’s actually a separate call number prefix for Sci-Fi outside of “FIC.” Gemini decided these books were more Sci-Fi than general fiction, though, so I left them in. In the future I’d probably take that option out of the list for Gemini.
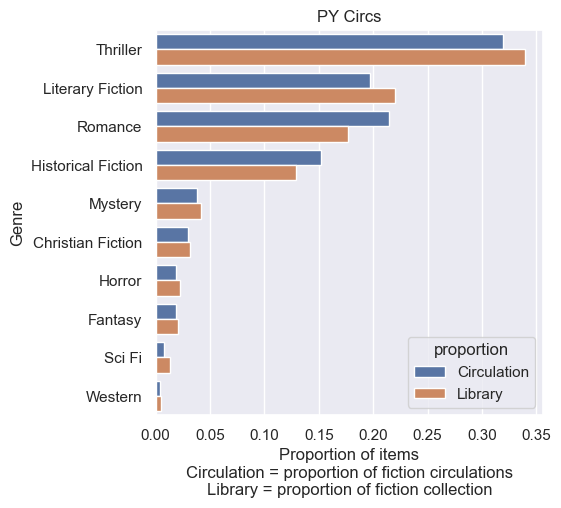
For the makeup of the library vs circulation I found (Fig 4):
Thriller: Largest genre by collection size (approx. 34%) and circulation share (approx. 32%).
Literary Fiction: Second largest by collection size (approx. 22%), contributing about 20% of circulations. Kind of unfortunate that this is the second largest since these didn’t get a sub-genre, but maybe that speaks to how difficult it is to classify fiction into neat categories.
Romance: About 18% of the collection, accounting for a higher share of circulations (approx. 21%).
Historical Fiction: Approx. 13% of the collection, 15% of circulations.
Other genres (Mystery, Christian Fiction, Horror, Fantasy, Sci-Fi, Western) make up smaller portions of the collection and circulations.
Final Thoughts
Overall this was a fun analysis to do. Patrons typically have a strong interest in new materials. Juvenile and Kendig Room (Large Print) seem to be the standout locations for the library, while Adult Nonfiction maybe could use a little something to make it more exciting. The genre breakdown was interesting to me since the top two genres — Thriller and Romance — (not including “Literary Fiction”) are not genres I personally gravitate towards, so it was fun to see those are the most popular and also have the largest proportion of the collection.
As with most analysis, I hope this answers some questions and brings up more. It didn’t take too long to do and with help from AI I was able to quickly label items well enough to do a more detailed analysis. I would be interested to hear from other libraries across the country to see if they have a similar makeup or if there is anything significantly different. I imagine also that since this is a relatively small local library, much larger libraries would look quite different. Let me know what you thought!